|
 |
 |
|
Beach Sands
|
 |
 |
|
While walking the Netarts and Oceanside beaches, you may have noticed our local sands are not all the same. They come in different colors. There is the usual light tan sand that we see on most of the beach, but there are darker sands that may form streaky layered patterns where fresh water streams wash over the shoreline or gentile waves ripple the sands.
Years ago these sands aroused my curiosity. Though I am not a geologist, I knew that the tan sand is composed mainly of quartz and feldspars. But the other sands, often segregated and concentrated into these streaks and layers, are colored either a dull dark brown or a shiny blue-black, and it seemed likely that their composition of minerals is different from those that make up the tan sands, and that probably the brown sand is different from the blue-black sand.
In the mid 1990s I was working with electron microscopes. During that time, I helped a young middle school student analyze some of these sands for a science fair project. One of the things we did was separate the heaviest sand, the blue-back fraction, from the light tan quartz/feldspar sand by panning, just like
|
|
|
 |
 |
|
microscope. The analytical part of the electron microscope, which I will describe below, indicated that the heavy fraction was rich in iron and titanium. We also measured the density of the two fractions and found that the density of the heavy fraction was about twice that of the light tan sand.
After retiring and moving to the Oregon coast, I again became curious about what minerals comprise the two darker sands, so I collected samples. I was fortunate to still have access to some sophisticated analytical instruments at the Pacific Northwest National Laboratory (PNNL) in Richland, Washington, so I analyzed these sands in a couple of different ways, once again by scanning electron microscopy coupled with x-ray microanalysis, which I did myself, and also by x-ray powder diffraction, which was performed by a friend and former colleague David McCready (see Addendum).
Analysis Methods
A scanning electron microscope (SEM) uses a focused beam of electrons, instead of light, to create an image of a specimen. X-ray microanalysis uses an x-ray detector, located near the specimen, to look at the energies of x-rays, a part of the electromagnetic spectrum, that are generated from a specimen that is being bombarded with the electrons from the electron beam. These x-rays are of a particular kind called “characteristic x-rays” because they are characteristic of the elements in the specimen. The different x-ray energies gave me information about the kinds of elements in each mineral, but did not necessarily identify the mineral itself.
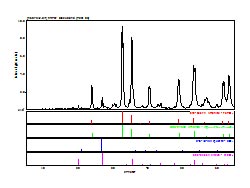
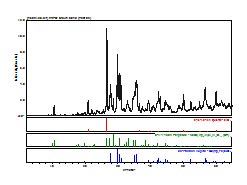
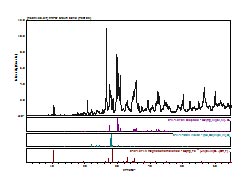
X-ray powder diffraction, a different kind of analysis and a very powerful tool in solid state chemistry, did identify the minerals. A specimen, first ground into a fine powder, is subjected to a beam of x-rays that are diffracted at certain angles that depend on the arrangement of atoms in the mineral’s basic crystal structure. Each mineral has it own crystalline structure and therefore its own pattern of diffractions that can serve as a fingerprint. The pattern can then be compared to the patterns from known minerals to identify the mineral type, just as a fingerprint from a crime scene can be compared with those taken from known criminals to identify a perpetrator. When a match is found, the mineral can be identified.
The minerals in the following discussion were identified by x-ray powder diffraction. The figures are from the SEM and x-ray microanalysis. They include a black and white SEM image1, an x-ray spectrum identifying elements in the sand grains, and x-ray maps indicating how the elements are distributed. Notice that the electron image has a scale bar from which one can get an idea of the size of the grains.
Mineral types found in the sands
The major mineral phase2 in the blue-black fraction is ilmenite, an oxide of titanium and iron with the chemical formula of Fe+2TiO3, where iron is of the ferrous variety.
|
 |
 |
|
Figure 2. Electron image, x-ray maps, and x-ray spectrum of ilmenite sand. The major constituents are oxygen, titanium (green), iron (red), and silicon (cyan). The large, off-scale peak to the left in the spectrum is carbon which was used in preparation of the specimen
|
 |
 |
|
The dark brownish fraction is a mixed bag of mostly pargasite, augite, diopside, magnesiohornblend, plus some albite (a feldspar), quartz, and a few minor phases, some of which probably crept from the other sands while sampling. Pargasite, a variety of feldspar named after the Pargas Valley in Finland, its type locality where it was discovered in 1814, is a brown to green mineral with the chemical formula NaCa2(MgFe+2)4Al(Si6Al2)O22(OH)2. Notice that many of these elements were detected by x-ray microanalysis (Figure 3), but do not identify pargasite, per se, since it contains many of the same elements as the other three major phases. Augite (pronounced o-jite) is a mixed metal aluminum silicate, [(Ca, Na)(Mg, Fe, Al, Ti)(Si, Al)2O6], in the pyroxene group3 that is found in igneous rocks such as gabbros and basalts. Its color is dark green or brown to black, and althought its surface is mostly rather dull, its name comes from the Greek word augites or “brightness” for the luster found in the best specimens. Diopside, also in pyroxene group, is a calcium, magnesium silicate, CaMgSi2O6, sometimes used as a gemstone, that can be white, green, or green-brown. It is found in basic or ultrabasic metamorphic or igneous rocks. Magnesiohornblend, Ca2(Mg, Fe+2)3Al(Si7Al)O22(OH,F)2, is a green to green-black mineral in the amphibole group4.
|
 |
 |
|
Figure 3. Electron image, x-ray maps, and x-ray spectrum of grains from brownish sand. Major elements include magnesium (orange), calcium (yellow), aluminum (violet), titanium (green), silicon (cyan), and iron (red). Notice that these grains are larger than the ilmenite grains.
|
 |
 |
|
Figure 4. Electron image, x-ray maps, and x-ray spectrum of grains from tan sand. The elements mapped (from left to right) are sodium, potassium, calcium, aluminum, and silicon. Compare the sizes of these grains to those of the darker sands. Also, these sands are more angular and less rounded than those of the darker sands.
|
 |
 |
|
SEM analysis of the tan quartz/feldspar sand is shown in Figure 4. Note the large size and angular appearance of these grains. One reason for their sharper edges is that quartz and feldspar are harder than the other minerals and do not wear as easily (Robert Witter, Regional Coastal Geologist, pers. comm.).
One caveat to the interpretation of mineralogy of these sands is that the grains are not always homogeneous, that is they may include more than one mineral phase as shown in Figure 5 by some grains from the blue-black fraction of beach sand.
|
 |
 |
|
Backscatter electron image
|
|
|
|
 |
 |
|
Figure 5. Backscatter electron image and x-ray maps of heterogeneous sand grains. Backscattered electrons are sensitive to the atomic number (number of protons in the nucleus of an atom) of the elements in the specimen. Elements with high atomic numbers appear lighter in an image than those with lower atomic numbers. Note the different mineral phases and their constituent elements in the individual grains.
|
 |
 |
|
Where did these minerals come from?
The exact origins of these sands are not clear cut. The dense ilmenite, a placer deposit, probably came from Coast Range mountains, from the basalt and other igneous rocks of ancient volcanic seamounts that make up the backbone of the Coast Range (Komar 1998, Orr and Orr 2000, Bishop 2003, Robert C. Witter, pers. comm.). Our local basalts are Grande Ronde basalts, massive layers of lava that originally flowed westward from eastern Washington and Oregon 15 to 18 million years ago and here formed Cape Meares, Cape Lookout, Three Arch Rocks, and other nearby sea stacks and cliffs. According to Dr. Stephen Reidel of PNNL and Washington State University (pers. comm.), these basalts contain titanomagnetite, but no pure ilmenite, so they are an unlikely source of this mineral. Other minerals in the sand, including augite and diopside, may also come from Coast Range basalt flows or marine sedimentary rock derived from eroded basic igneous rocks common in our area. Some of the minerals may have come from sediments washed out of the Columbia River thousands of years ago. Some may have even come from the Klamath Mountains in southern Oregon and northern California (Bostrom and Komar 1997, Komar 1997, Paul Komar, pers. comm.).
Beach sand is moved by near-shore, wave-generated currents (Komar1998). Much of the sand now washing out of Columbia River is deposited by these currents northward along the Washington coast. It is interesting to note that what sand washes south gets only as far as Tillimook Head, which serves as a barrier to any further southerly transport. It is important to note that, like Tillimook Head, the rocky seaward extensions of Cape Meares and Cape Lookout in our area currently form barriers to alongshore transport of sediments. The stretch of shore between these headlands is called a littoral cell, a kind of self contained region where sediment transports are more local. There are numerous littoral cells along Oregon that restrict coastal sand movement north or south.
These present headlands did not function as barriers during the ice ages. As Paul Komar, Professor Emeritus, Oregon State University, relates in his book “The Pacific Northwest Coast: Living With the Shores of Oregon and Washington (1998)”, during the ice ages a large amount of water was locked up in ice sheets and glaciers, and the level of the sea was lower than today’s sea level by about 125 meters (410 feet). This lowered sea level exposed vast areas of the continental shelf. The coastline, at that time located to the west of the current shore almost to the limit of the continental shelf, had a contour that probably conformed to the edge of the shelf, but the land on the shelf plane was fairly level and lacked headland barriers. Rivers draining the coastal mountains left sediments on this plane. Sands washed over the plane from the Klamath Mountains to the south of us, sediments flowing out of the Columbia River were deposited on the exposed landscape, and streams and rivers draining the coastal mountains dropped their loads of sediment. At the end of the last ice age, when the glaciers melted and their water was released back into the sea, the rising sea level allowed waves to move sediments up and down the coast, mixing them. As the sea finally rose to its present level and the headlands again became transport barriers, waves pushed the mixed sands shoreward onto the beaches of the littoral cells (Komar per. comm.). The sands from these distant sources, as a result of alongshore transport thousands of years ago, are the sands we find today on our beaches.
How do the sands sort into layers?
Two features of the different sands cause them to separate into the streaks and layers you see in Figure 1 and on the beaches between the Capes: density and grain size. I mentioned earlier that the density of blue-black sand, measured by the middle school student, was about twice that of the tan sand. To confirm this, you can find a deep deposit of ilmenite sand on the upper beach just below the Terry Moore Motel in Netarts. Take a handful of the ilmenite sand and compare its weight to a handful of the tan sand. You will see that the ilmenite sand is much heavier.
Now look at the micrographs (images) of the three sands taken by the SEM. You can see that the ilmenite has the smallest grains, the tan quartz and feldspars have the largest grains, and the grains of the brownish sands lie in between.
Paul Komar (pers. comm.) found that the low density and large size of the quartz and feldspar grains allowed them to be easily picked up by flowing water and rolled along the bottom, whereas the denser and smaller grains of the darker sands were more difficult to move. The small, dense ilmenite moved the least of all. These two features, density and grain size, are why the middle school student could “pan” out the ilmenite and why fresh water streams and the retreating swash of ocean waves can separate the different colored sands on our beaches.
References:
Bishop, E. M. 2003. In Search of Ancient Oregon: A Geological and Natural History. Timber Press.
Bostrom, G. and P.D. Komar. 1997. Rocks of the Tillamook Bay Drainage Basin, the Coast Range of Oregon – Sources of Sediment Accumulation in the Bay. Report to the Tillamook Bay National Estuary Project.
Komar, P. D. 1997. Sediment Accumulation in Tillamook Bay, Oregon, A Large Drowned-River Estuary. Report to the Tillamook Bay National Estuary Project.
Komar, P. D. 1998. The Pacific Northwest Coast: Living With the Shores of Oregon and Washington. Duke University Press.
Orr, E. L., and W. N. Orr. 2000. Geology of Oregon, 5th ed. Kendall/Hunt Publishing Company.
Text and Figures by Jim Young
Oceanside, Oregon
jsy4990@embarqmail.com
|
 |
 |
|
___________________________________________
|
 |
 |
|
1 The images were created by backscattered electrons rather than secondary electrons. Backscattered electrons are beam electrons that are elastically scattered by the specimen at angles greater than 90 degrees. Backscattering increases with increasing atomic number of the elements in the specimen, making heavy elements, that is those with higher atomic numbers, brighter than those with lower atomic numbers.
2 Phase is a technical term that refers to a physically distinct portion of non-homogeneous matter.
3 The pyroxene group of minerals include those in the general formula ABZ2O6, where A = Ca, Fe+2, Li, Mg, Na; B = Al, Cr+3, Fe+2, Fe+3, Mg, Mn+2, Se; Z = Al, Si.
4 Amphiboles contain very complex hydrous silicate minerals that come from metamorphic and igneous rocks.
Acknowledgements
This work was conducted at the Environmental Molecular Sciences Laboratory, a national user facility of Pacific Northwest National Laboratory. Pacific Northwest National Laboratory is operated for the U. S. Department of Energy by Battelle Memorial Institute under Contract No. DE-AC06-76RLO 1830. Special thanks goes to David McCready for XPRD analyses. I thank Paul Komar for reviewing this article.
Addendum: XRPD results:
Sample: Black Sand
Major Phases: Two solid solutions of Ilmenite (represented here by PDF 070-6267 and 083-2428)

Sample: Brown Sand
Major Phases: Quartz (PDF 046-1045), Pargasite (PDF 041-1430), Augite (PDF 024-0203) Diopside (PDF 041-1370), Albite (PDF 041-1480), Magnesiohornblende (PDF 045-1371)
 
|
|
|
|

